What is a Line Plot?
A Line plot can be defined as a graph that displays data as points or check marks above a number line, showing the frequency of each value.
Here, for instance, the line plot shows the number of ribbons of each length.

| Fun Facts – A line plot is often confused with a line graph. A line plot is different from a line graph. |
 Begin here
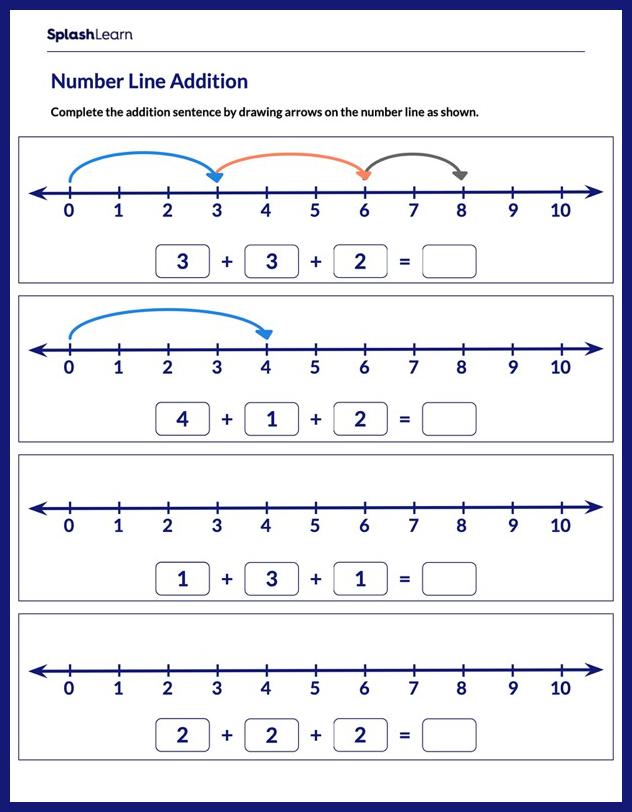
Count On Strategy
Add and Mark the Sum on the Number Line Game
 Play
Play
Add Fractions
Add Fractions WIth the Aid of a Number LIne Game
 Play
Play
Add Fractions
Add Like Fractions using Number Lines Game
 Play
Play
Add mixed numbers
Add the Mixed Number and the Fraction on a Number Line Game
 Play
Play
Organize data in line plots
Analyze and Represent Data Using Line Plots Game
 Play
Play
Organize data in line plots
Analyze Data Using Line Plots Game
 Play
Play
Interpret data in line plots
Answer How Many More or Less using line plots Game
 Play
Play
Represent Decimals on Number Lines
Choose the Decimal Number Represented on The Number Line Game
 Play
Play
Mixed Numbers as Fractions
Choose the Fraction Marked on the Number Line Game
 Play
Play
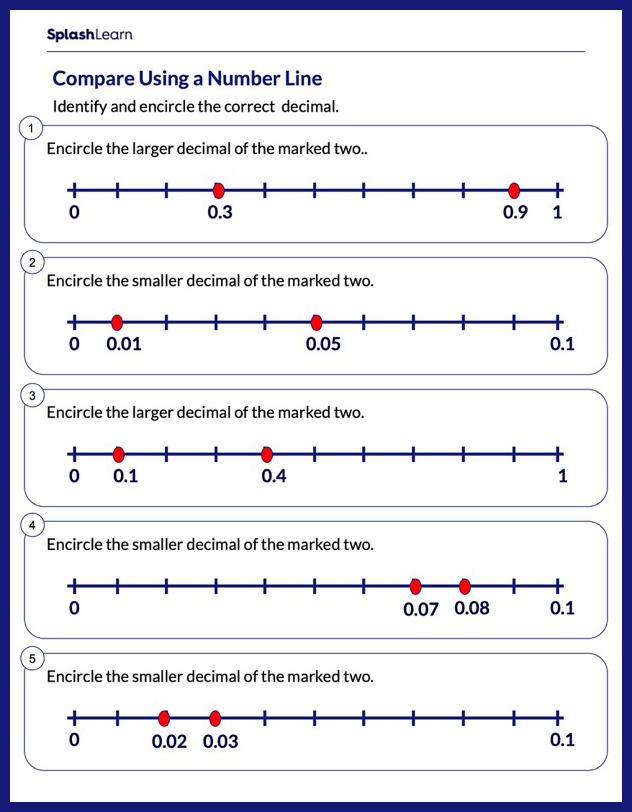
Compare decimals
Compare Decimals Using Number Line Game
 Play
Play
 Let’s sing!
To draw a line plot,
A number line to ought,
The different values we sort.
Making data easy to spot!


 Let’s do it!
Ask your child to jot down the total number of money he spends daily during week. Ask him to represent the data using a line plot.
 Related Math Vocabulary